Posts Tagged: water


OMG! California has snow! But no water???
You know those days when you look at your bank account statement and just think:
I can see money coming in on a regular basis, but… why is the account so empty?
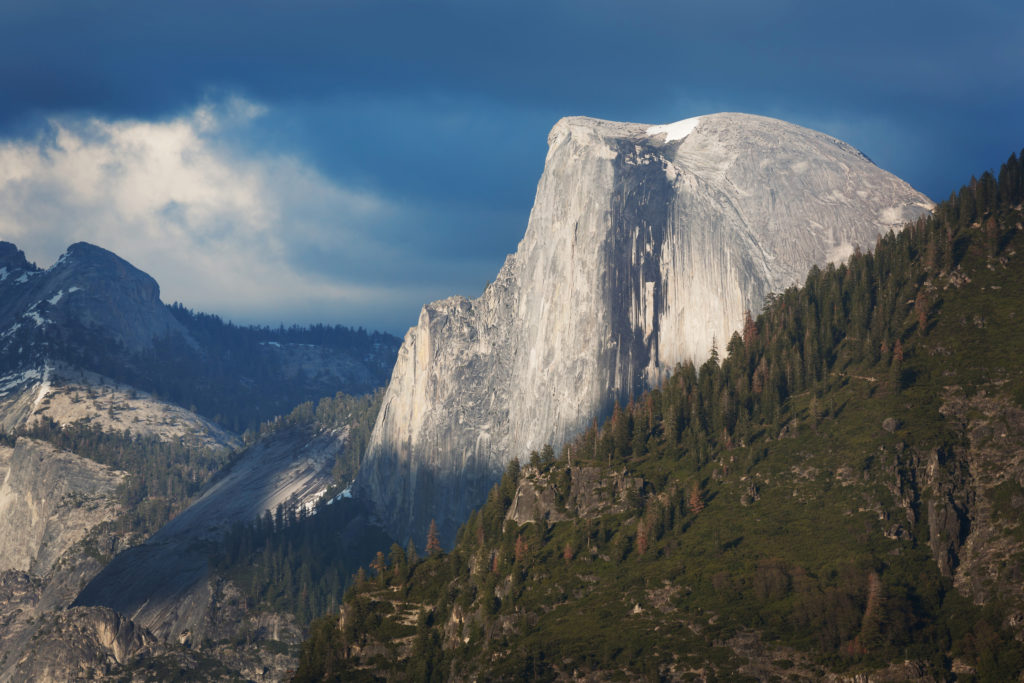
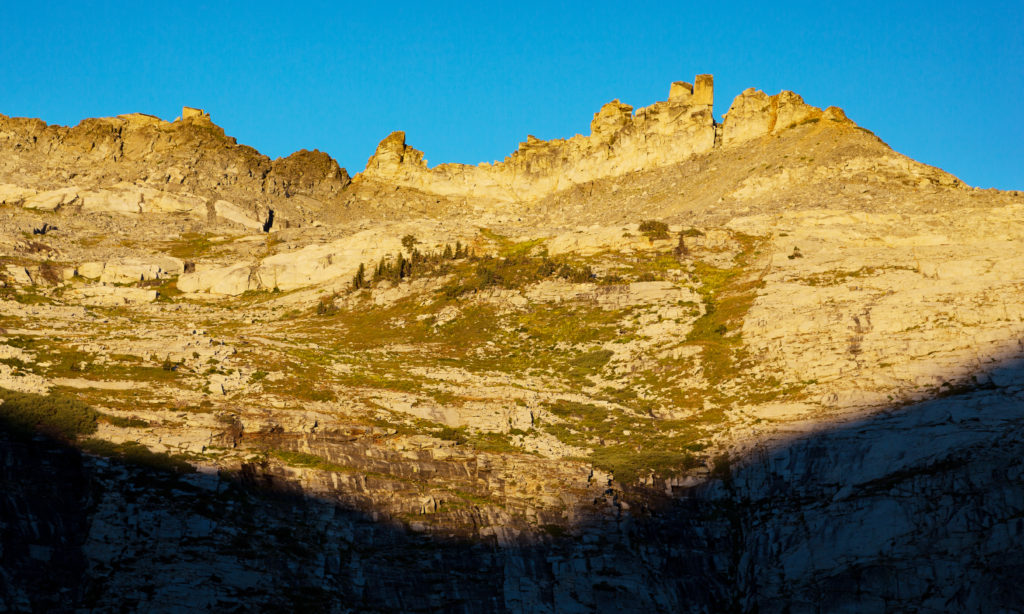
Well, California is sort of in a similar state [pun intended]. It’s been clear that we have plenty of incoming snow this year:
I took this image of the wonderfully snowy mountains in mid-January, and there was multiple feet of snow sticking to the ground. Last year in January of 2015, however, I was walking around on dirt. So we’re definitely much better off, from my single point of inspection.
So, why then, are we being told to keep conserving water??? Well, I looked into that. And it turns out that the above bank analogy is rather fitting. You know how you get those credit card statements that say:
If you pay the minimum amount due every month, this account will be paid off in 2089
and all the while, you’re continuing to charge more to the account too. I mean… drink more water.
Well, the water system in California is rather similar. Yeah, the money is coming in but unless we pay down the debt, we’ll never get out of it. And trust me, you don’t want to get stuck in water bankruptcy. It’s even less pleasant than financial bankruptcy.
Let’s look at two images from the California Department of Water Resources and the California Data Exchange Center describing the difference between the snow pack levels and water levels:
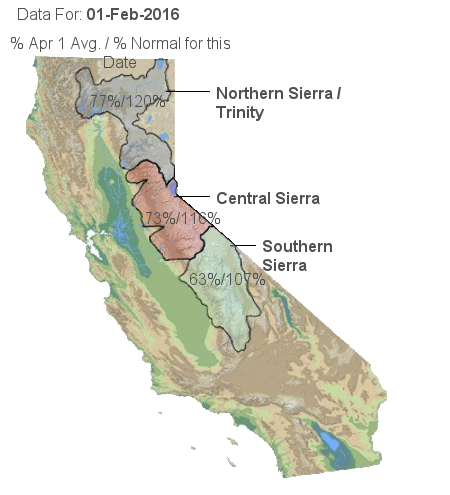
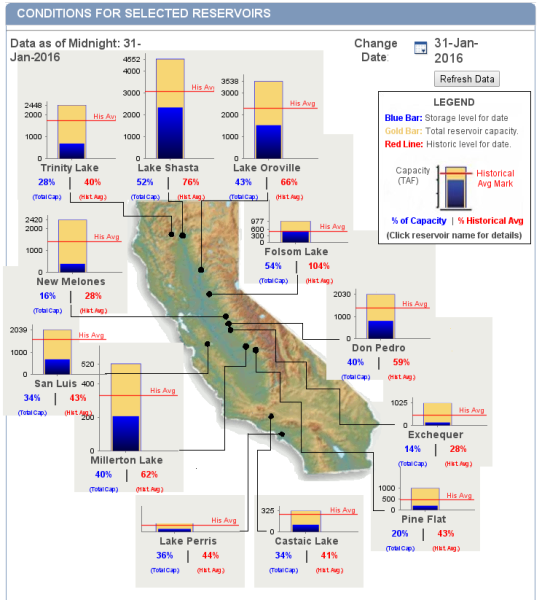
The first image shows clearly that Northern California is doing very well, snow-pack wise (> 100% of normal at this time of year!!). But the second image shows how low our reservoirs are. The difference between the blue bars and the red line is functionally the “water missing” from the reservoirs. I.E., the water level should be up to the red line, but it falls (far) short in most cases. Taking this back to the credit card analogy, the difference between the blue bar and the red line is functionally the difference between what a credit card statement says and what you can actually pay. Sure, you can let your debt pile up, but eventually when you run out of credit you’re in real trouble. And when you run out of water credit, we’ll get really really thirsty.
In short, there is no way what-so-ever we’re going to pay back our debt in a year. And this is why all the water agencies say, and news reports pass on, that even though our snow pack is at 116%, our normal percentage stored is still well below average. But unlike lines of credit, which banks never seem to mind giving you more of, there is no “extra water bank” you can run to if we get more bad years ahead of us.
The reality is that we just got a temporary seasonal job and the money is good, but our savings account is still depleted, our credit cards are maxing out, and we don’t know what bills are coming in the future years.
I strongly recommend clicking on the images above to get to the real data. It’s fascinating (if you’re a numbers geek like me) to browse around and view the raw numbers describing the state’s situation). And the data is updated regularly.
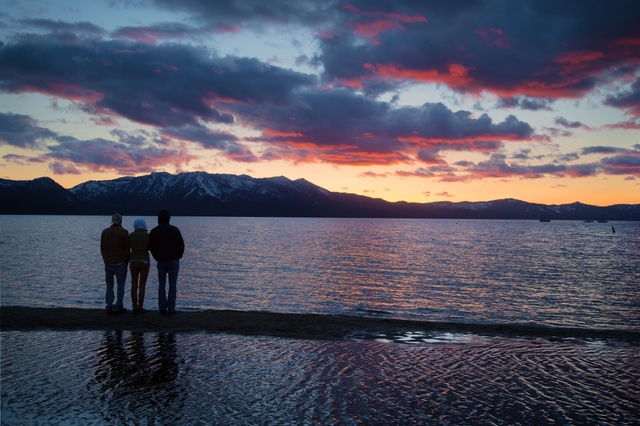
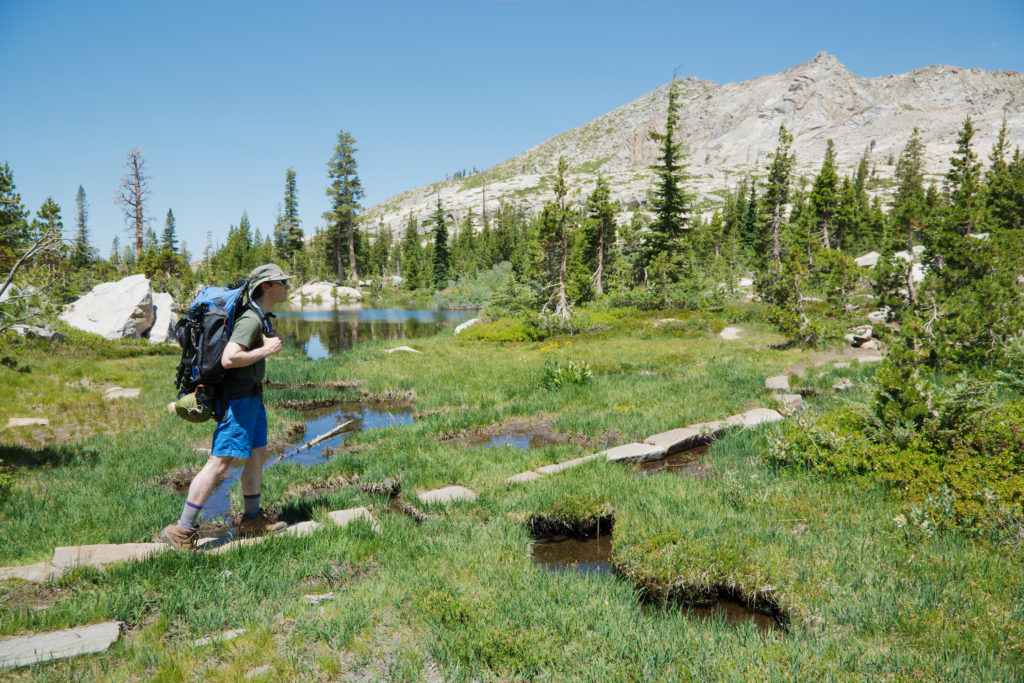
But, I’m a photographer and just got side tracked by numbers. So, here’s a few more close up pictures of that oh-so-pretty white stuff from January’s snow fall (click for High Resolution versions):
Please forward this message to anyone you feel might want to (or needs to) read it.